The Dual Input Flow Meter Assembly (DIFMA) gives the user unprecedented levels of information all while being safe, efficient and reliable.
No more guess work, no more lost paperwork, just repeatable recorded results.
This is a graph of two pumps which have been tested using the control sequence inbuilt into the DIFMA control system and recorded on the data logger
The results have been overlayed to create a comparison. The two pressure readings that are controlled by the DIFMA are:
Purple on graph – “Pilot instruction” (PI) hydraulic signal – this is the flow control signal from the DIFMA which replicates the PI signal normally sent from the machine control. As this pressure increases the flow rate of each pump increases correspondingly.
Green on graph – “Load” pressure trace shows the controlled application of the flow restriction applied by the load valves.
The first thing to note is the controlled test sequence pre-programmed into the DIFMA allows for identical test conditions and repeatable results.
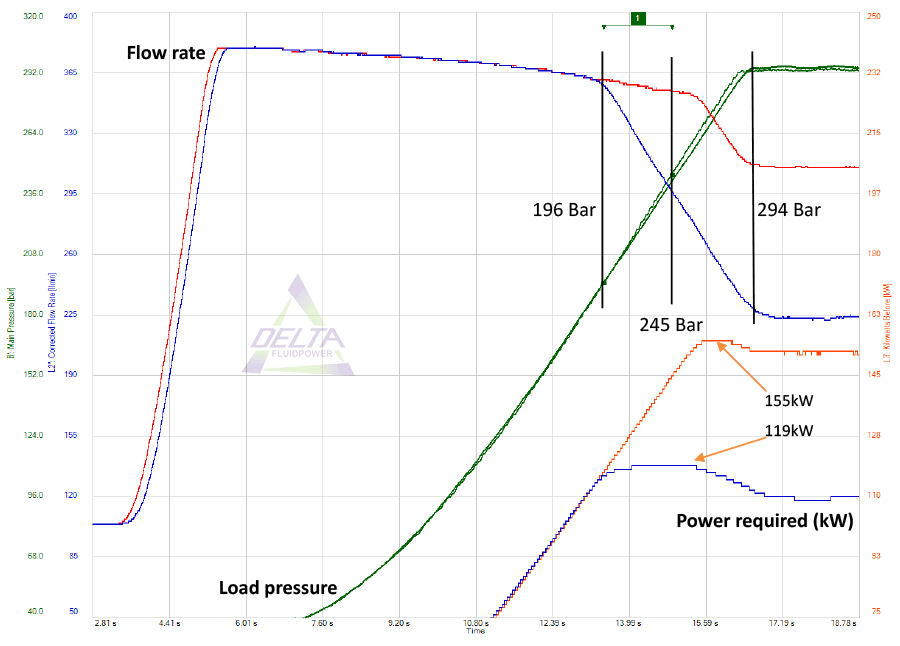
The red and blue pressure traces show the resulting flow rates of the individual pumps.
If this flow test was measured using the manual flow meter it would be considered that both pumps would be very close to the OEM specifications in the all the specified pressure ranges (less than 2%) except the highest pressure.
Both are actually flowing low at 294 Bar. 8% for the red pump and 5% for the blue pump.
In fact going by manual test results alone it would be tempting to increase the flow at some pressures on the red pump and decrease flow at some pressures on the blue pump.
The problem is the single point test pressure/ flow readings don’t show the whole picture.
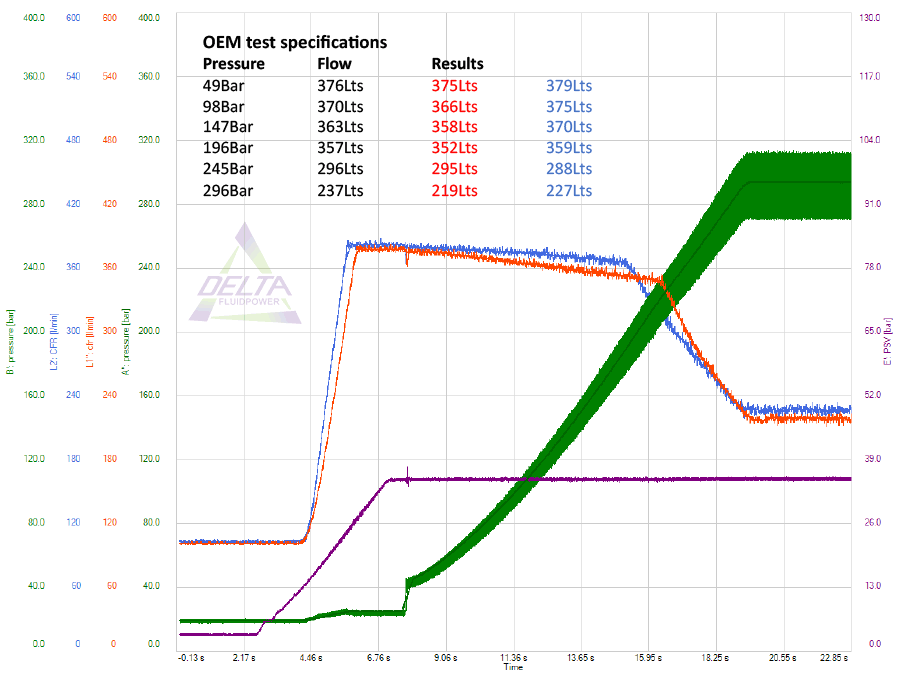
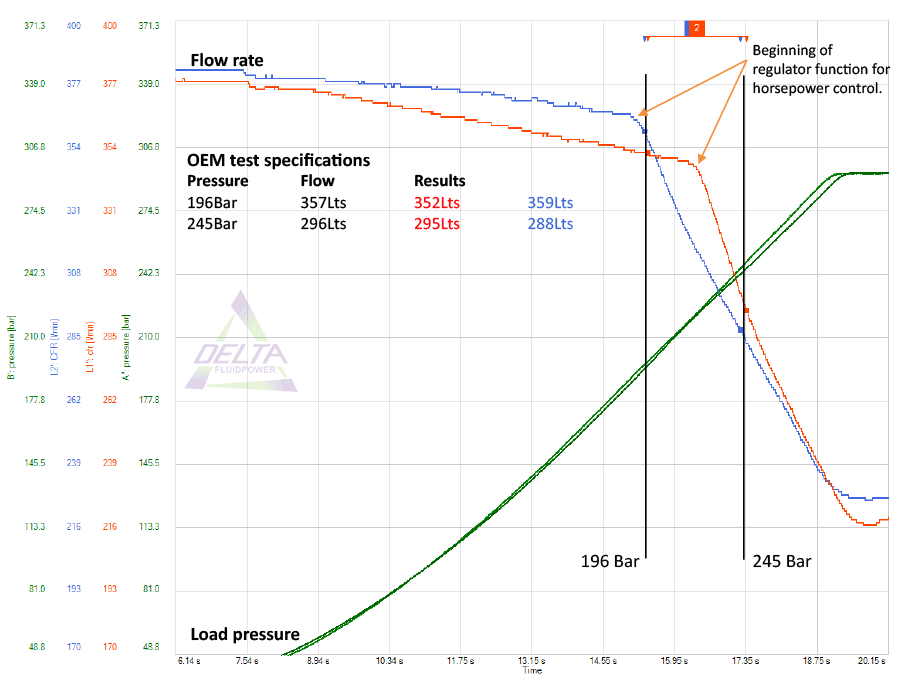
This next graph is the same as the previous, we have zoomed in to better see the results and have a filter applied to show the average readings.
These recordings have a measurement every millisecond, the filter applied would be close to what would be seen using a standard buffered gauge or flow meter display.
The regulators used on the Hitachi pumps have only two adjustments possible for the horsepower control, the first allows adjustment of flow rates up to the 196 Bar range, the second adjustment affects flow rates at the 245 Bar to 294 Bar range. Any adjustment at either points affects all flow rates in that adjustment range.
So what is the difference?
Blue on graph – The blue pump has a slightly high reading at 196 Bar, but as seen on the graph, this point is on the down slope of the flow reading, this indicates the regulator has began reducing flow and is operating correctly, minor adjustments to reduce the flow rate further at this point would increase regulator life. Minor adjustments would also be required at 245 Bar. An increase in flow here would also bring the flow rate up at 294 Bar which would be closer to OEM specification.
Red on graph – The red pump is low at 196 Bar, the regulator horsepower control has not begun to operate yet, in fact it does not begin to reduce flow at all until nearly 222 Bar, any increase in adjustment to bring the 196 Bar flow rate closer to specification would result in an increase in flow all the way to the 245 Bar adjustment.
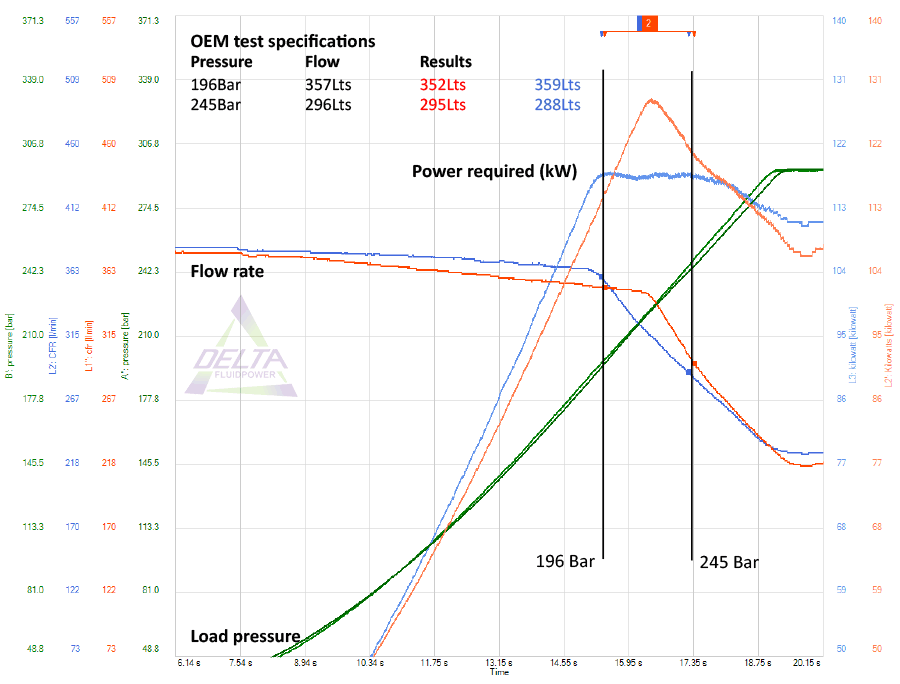
This final graph shows both pumps again, this time with the calculated horsepower requirements of the two pumps displayed.
It shows that there is already 10% more horsepower required to drive the red pump at 225 Bar. This extra horsepower requirement starts at 200 Bar all the way to 260 Bar. Further adjustments to increase the flow rate of this pump will increase the horsepower requirement.
- It takes approximately 210 Bar to lift the boom (empty bucket) on a Hitachi EX5600-6.
- The majority of the machine’s operation under load is in the 200 – 260 Bar range.
Consistent power requirements through out the working range as shown on the flat power curve of the blue pump result in a more even load on the engine, the system is less prone to surge or hunting, which reduces wear on all components in the system.
Single point static measurements do not tell the whole story of what is really happening in a dynamically controlled system.
- A 10% increase in engine load on a “tuned” pump group will use 400L of diesel more than it should due to inaccurate test and adjustment results.
Pump Test (Before/After)
The following test result is an overlay of EX5600-6 pump before and after adjustments have been made. This is one of the six pumps which is part of the total pump group graph displayed on the first slide of this presentation.
This excavator did not display any signs of “hunting”
The red flow rate line shows the regulator not functioning correctly, this has resulted in an almost 25% increase in horsepower required.
The blue line shows the regulator after adjustment, with the horsepower control now functioning correctly.
| Pressure | Flow | Results | |
|---|---|---|---|
| 49Bar | 376Lts | 376Lts | 376Lts |
| 98Bar | 370Lts | 372Lts | 372Lts |
| 147Bar | 363Lts | 367Lts | 367Lts |
| 196Bar | 357Lts | 361Lts | 356Lts |
| 245Bar | 296Lts | 354Lts | 294Lts |
| 296Bar | 237Lts | 311Lts | 224Lts |
- A pump group that is consistently over-flowing, or causing the engine to hunt can burn up to 2000L a shift more than a correctly tuned system.
- Hunting engines due to excess hydraulic load causes increased wear and damage on other associated systems, for example, when hunting or going on and off “Power Decrease” the rapid changes in engine speed induce pressure spikes in the fan pump and fan motor circuit of up to 130 Bar (1900 Psi).